Practice Overview Report
Give yourself the gift of time with automated veterinary practice reporting
Visually appealing veterinary reports delivered monthly means you can spend less time pulling data and more time taking action on results.
Track the health of your practice in 3 key areas
Stop struggling to get data out of your practice management system and start enjoying an accurate monthly Practice Overview Report showing your most important metrics.
Patient activity metrics
Track the status of your clients and patients with multiple metrics aimed at providing a complete view of patient activity in your veterinary practice.
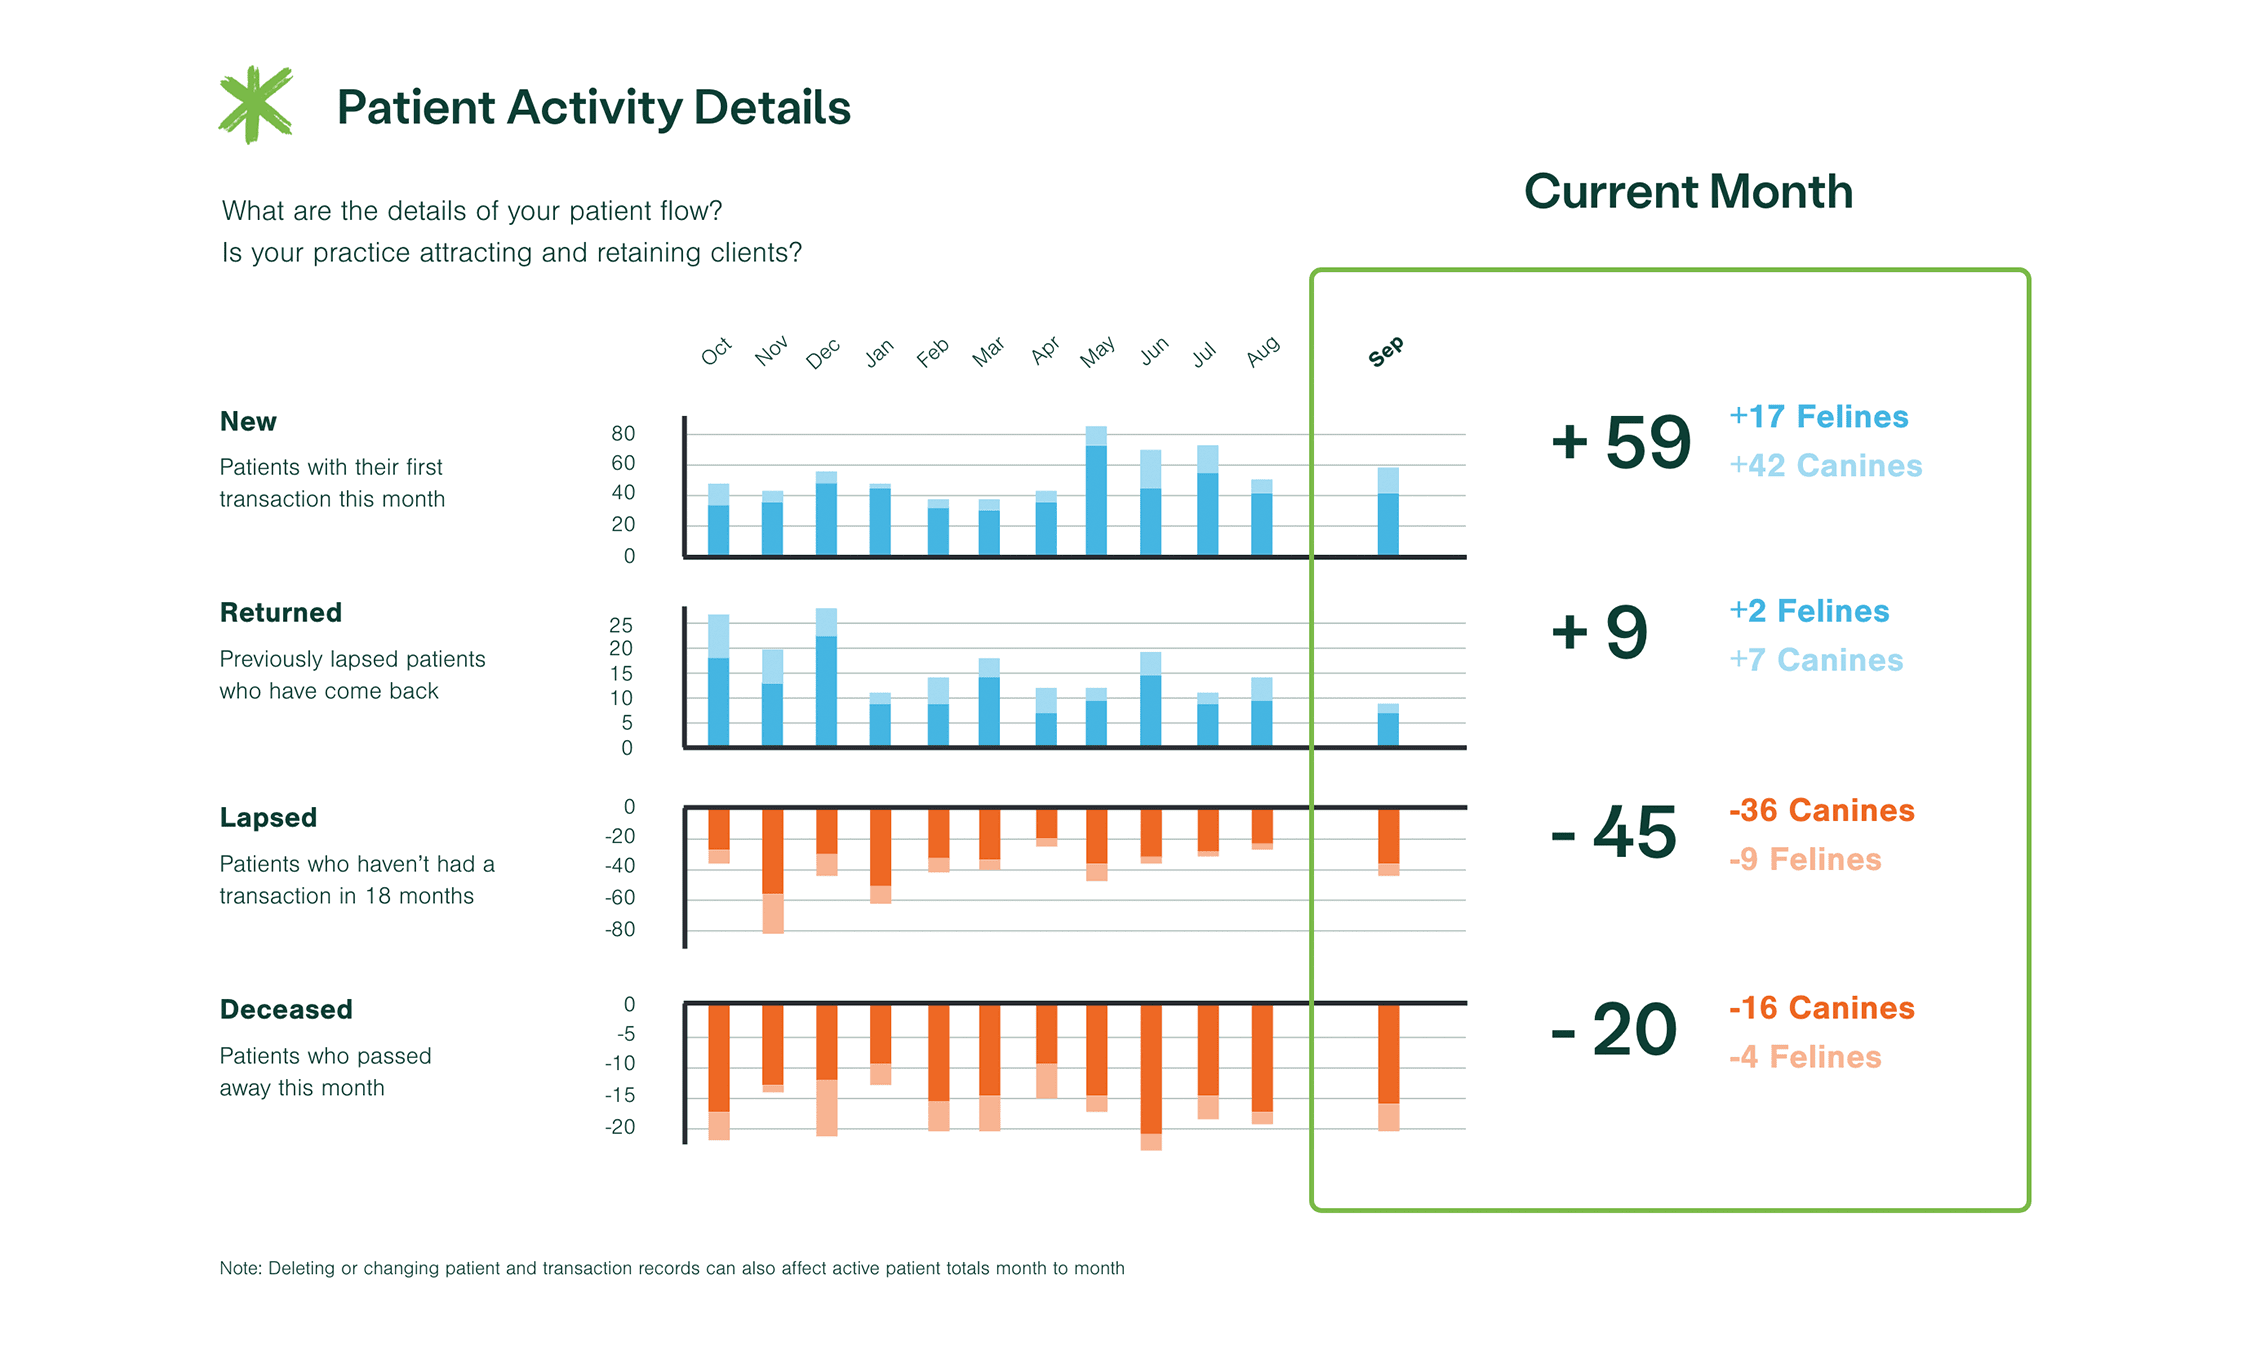
Is your veterinary practice growing? Are you adding patients faster than losing them?
Many practices track new patients each month, but are you tracking lost patients as well? Similar to your bank account, your practice’s “patient balance” at the end of each month should be growing.
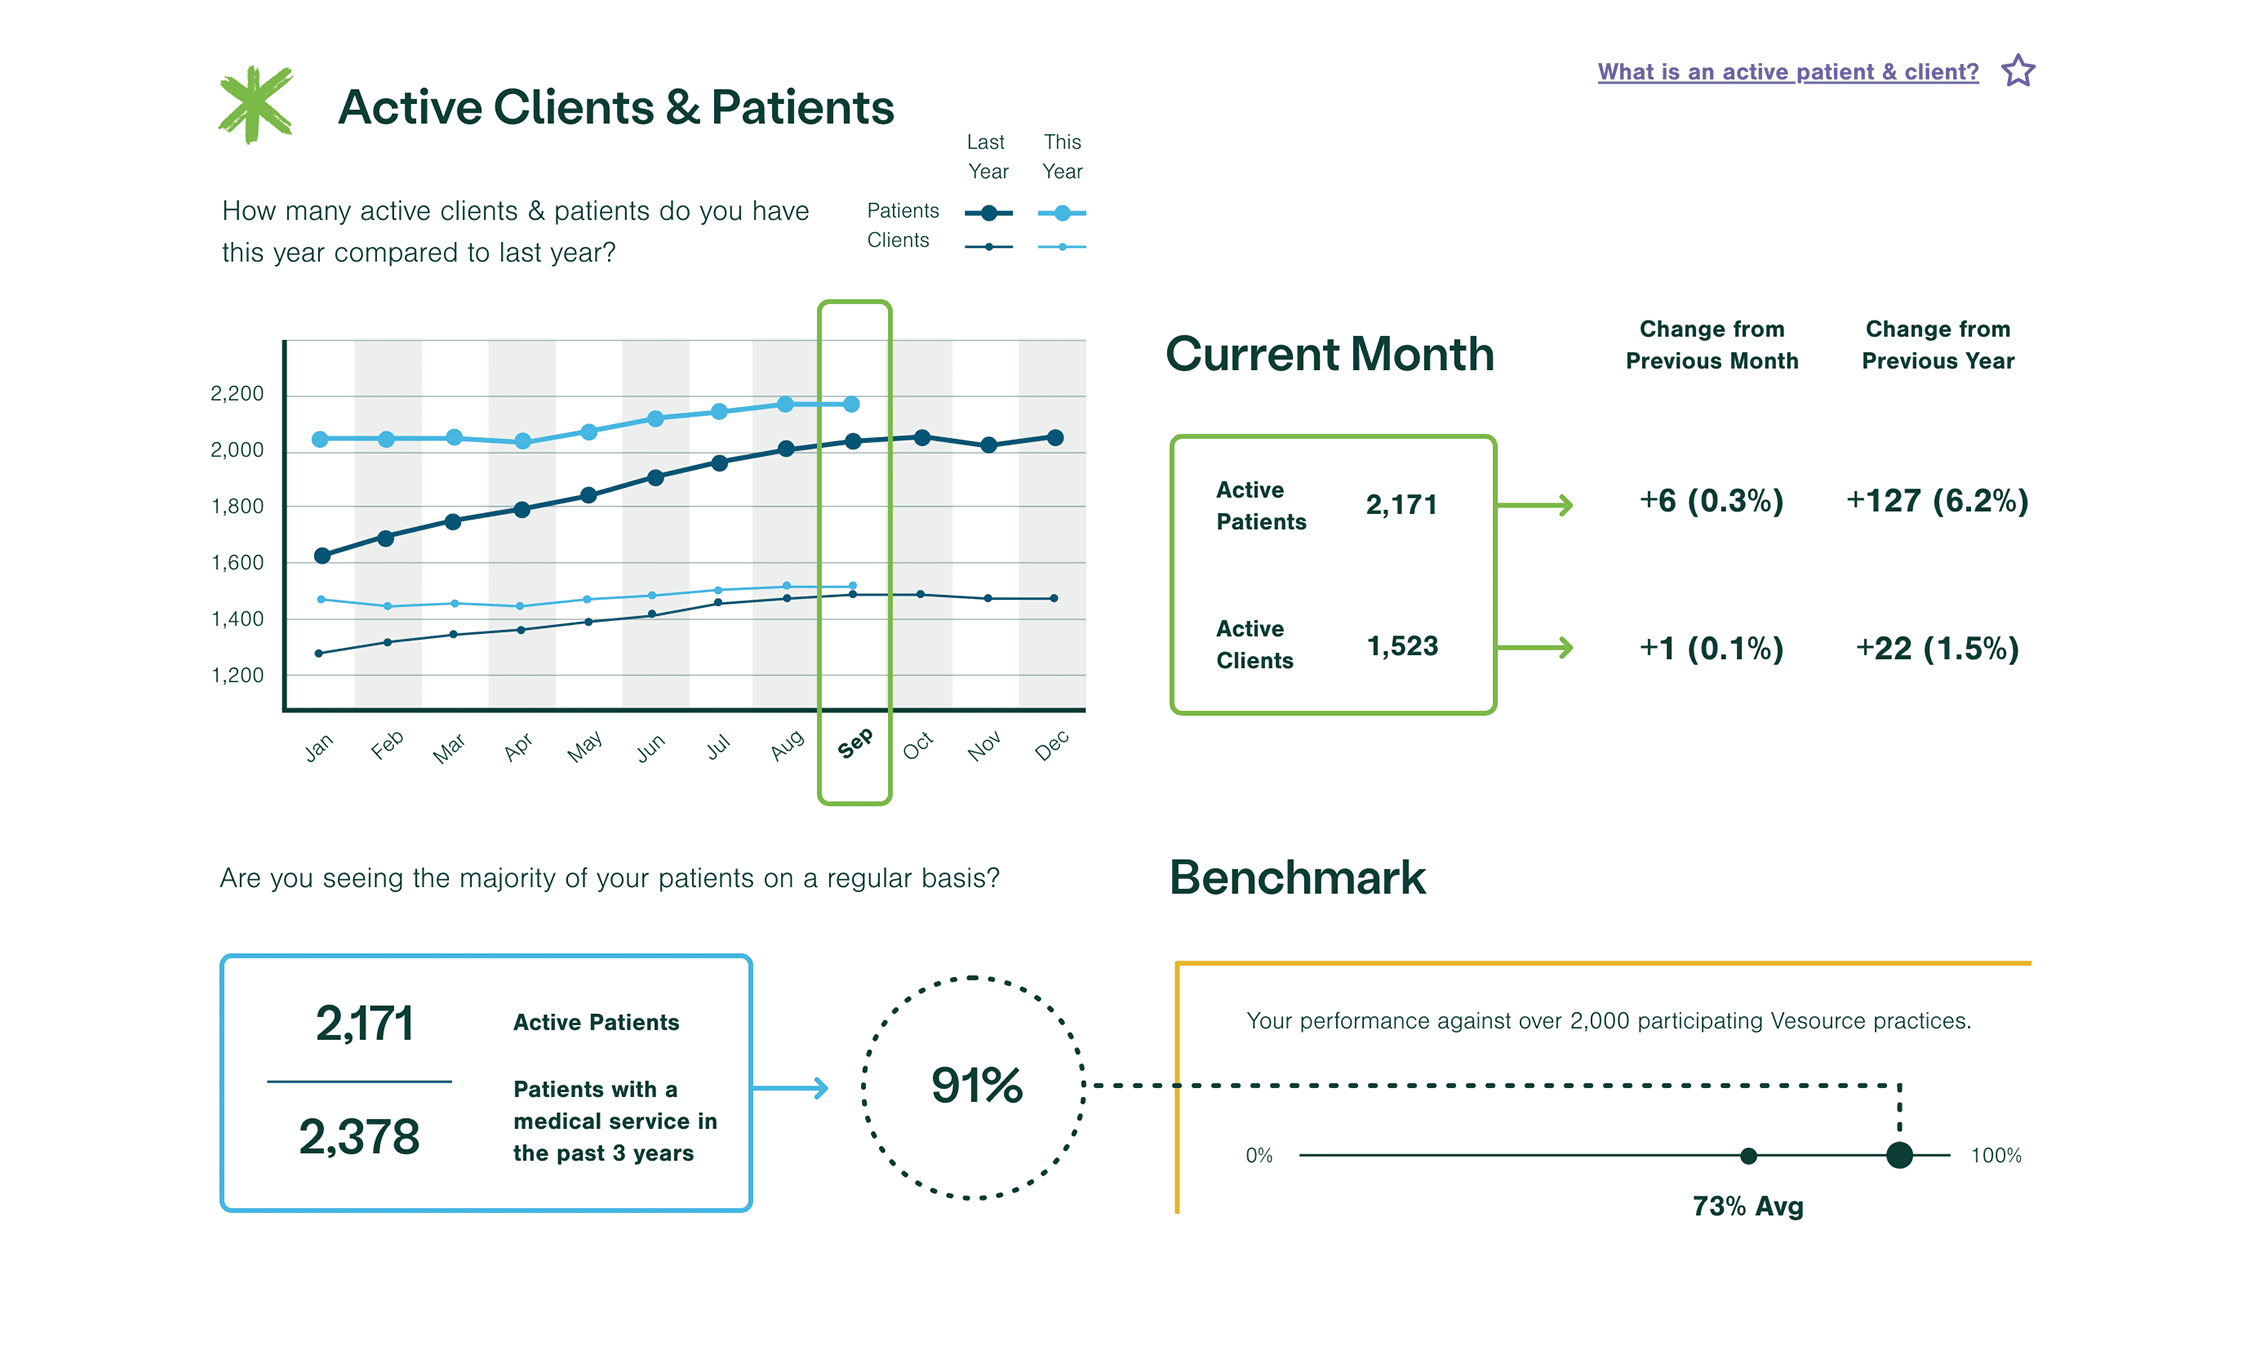
What is your 12-month active client and patient trend?
Are your active clients and patients trending up or down this year? And how does that compare to the previous 12 months? A negative net change indicates a shrinking patient and client base.
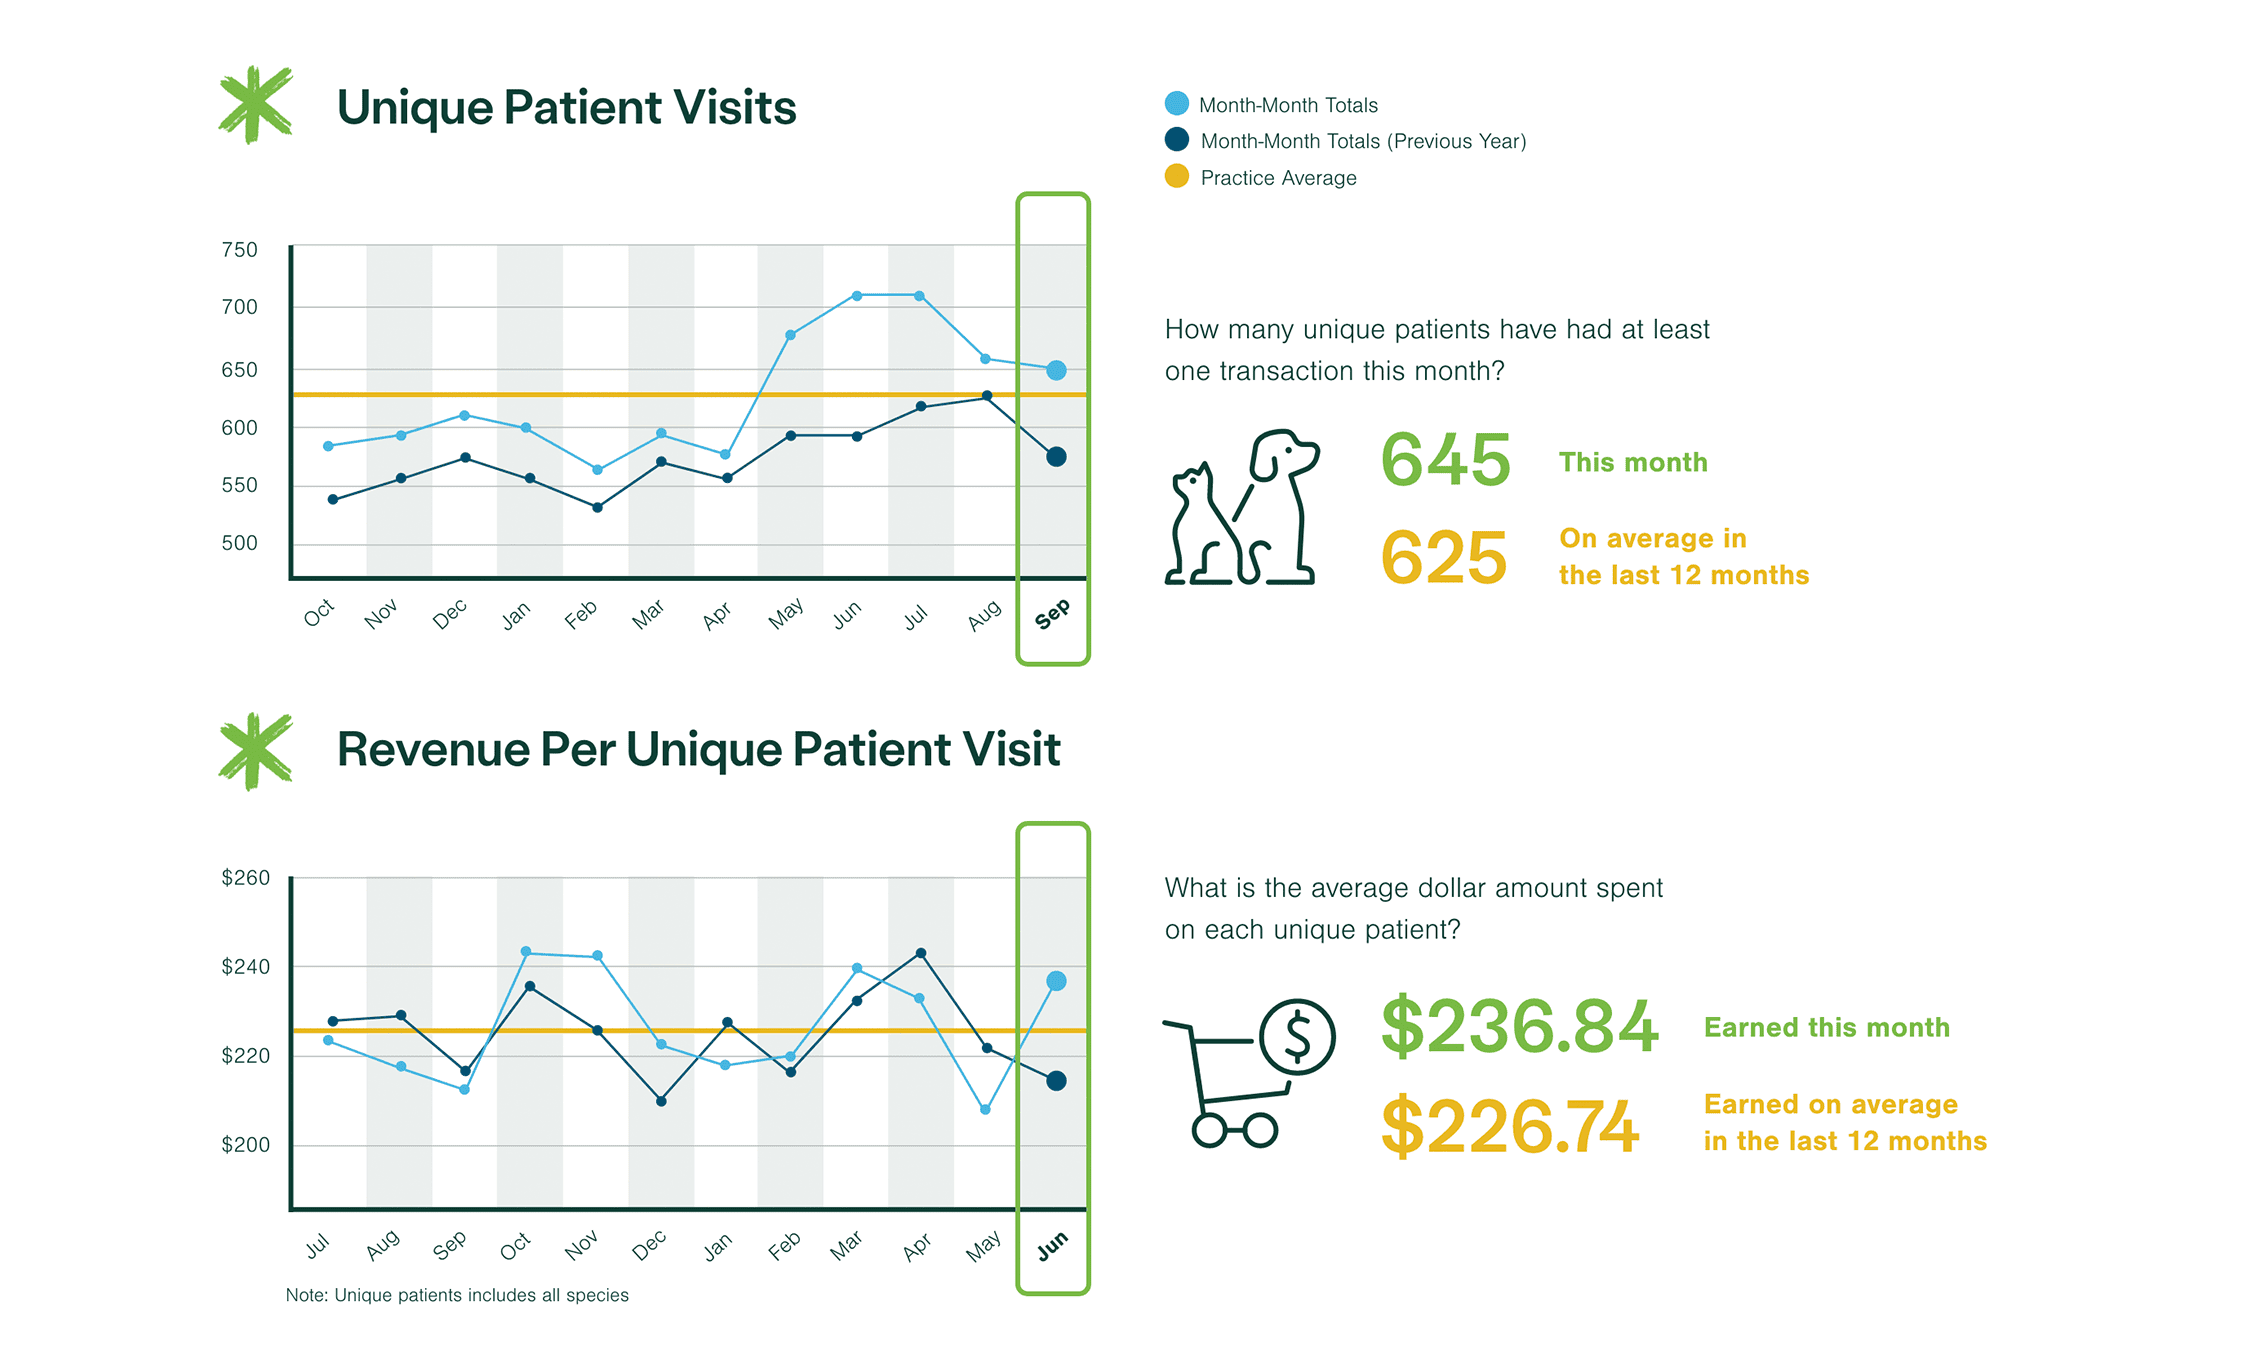
Are you serving more patients and providing the best care?
Looking at the number of invoices or average client transaction (ACT) may not answer these questions if you consider multiple visits from the same patient, retail purchases, pharmacy refills, and $0 services, like suture removals.
Easily compare the number of unique patients treated in your practice each month, and the average revenue earned from each unique patient.
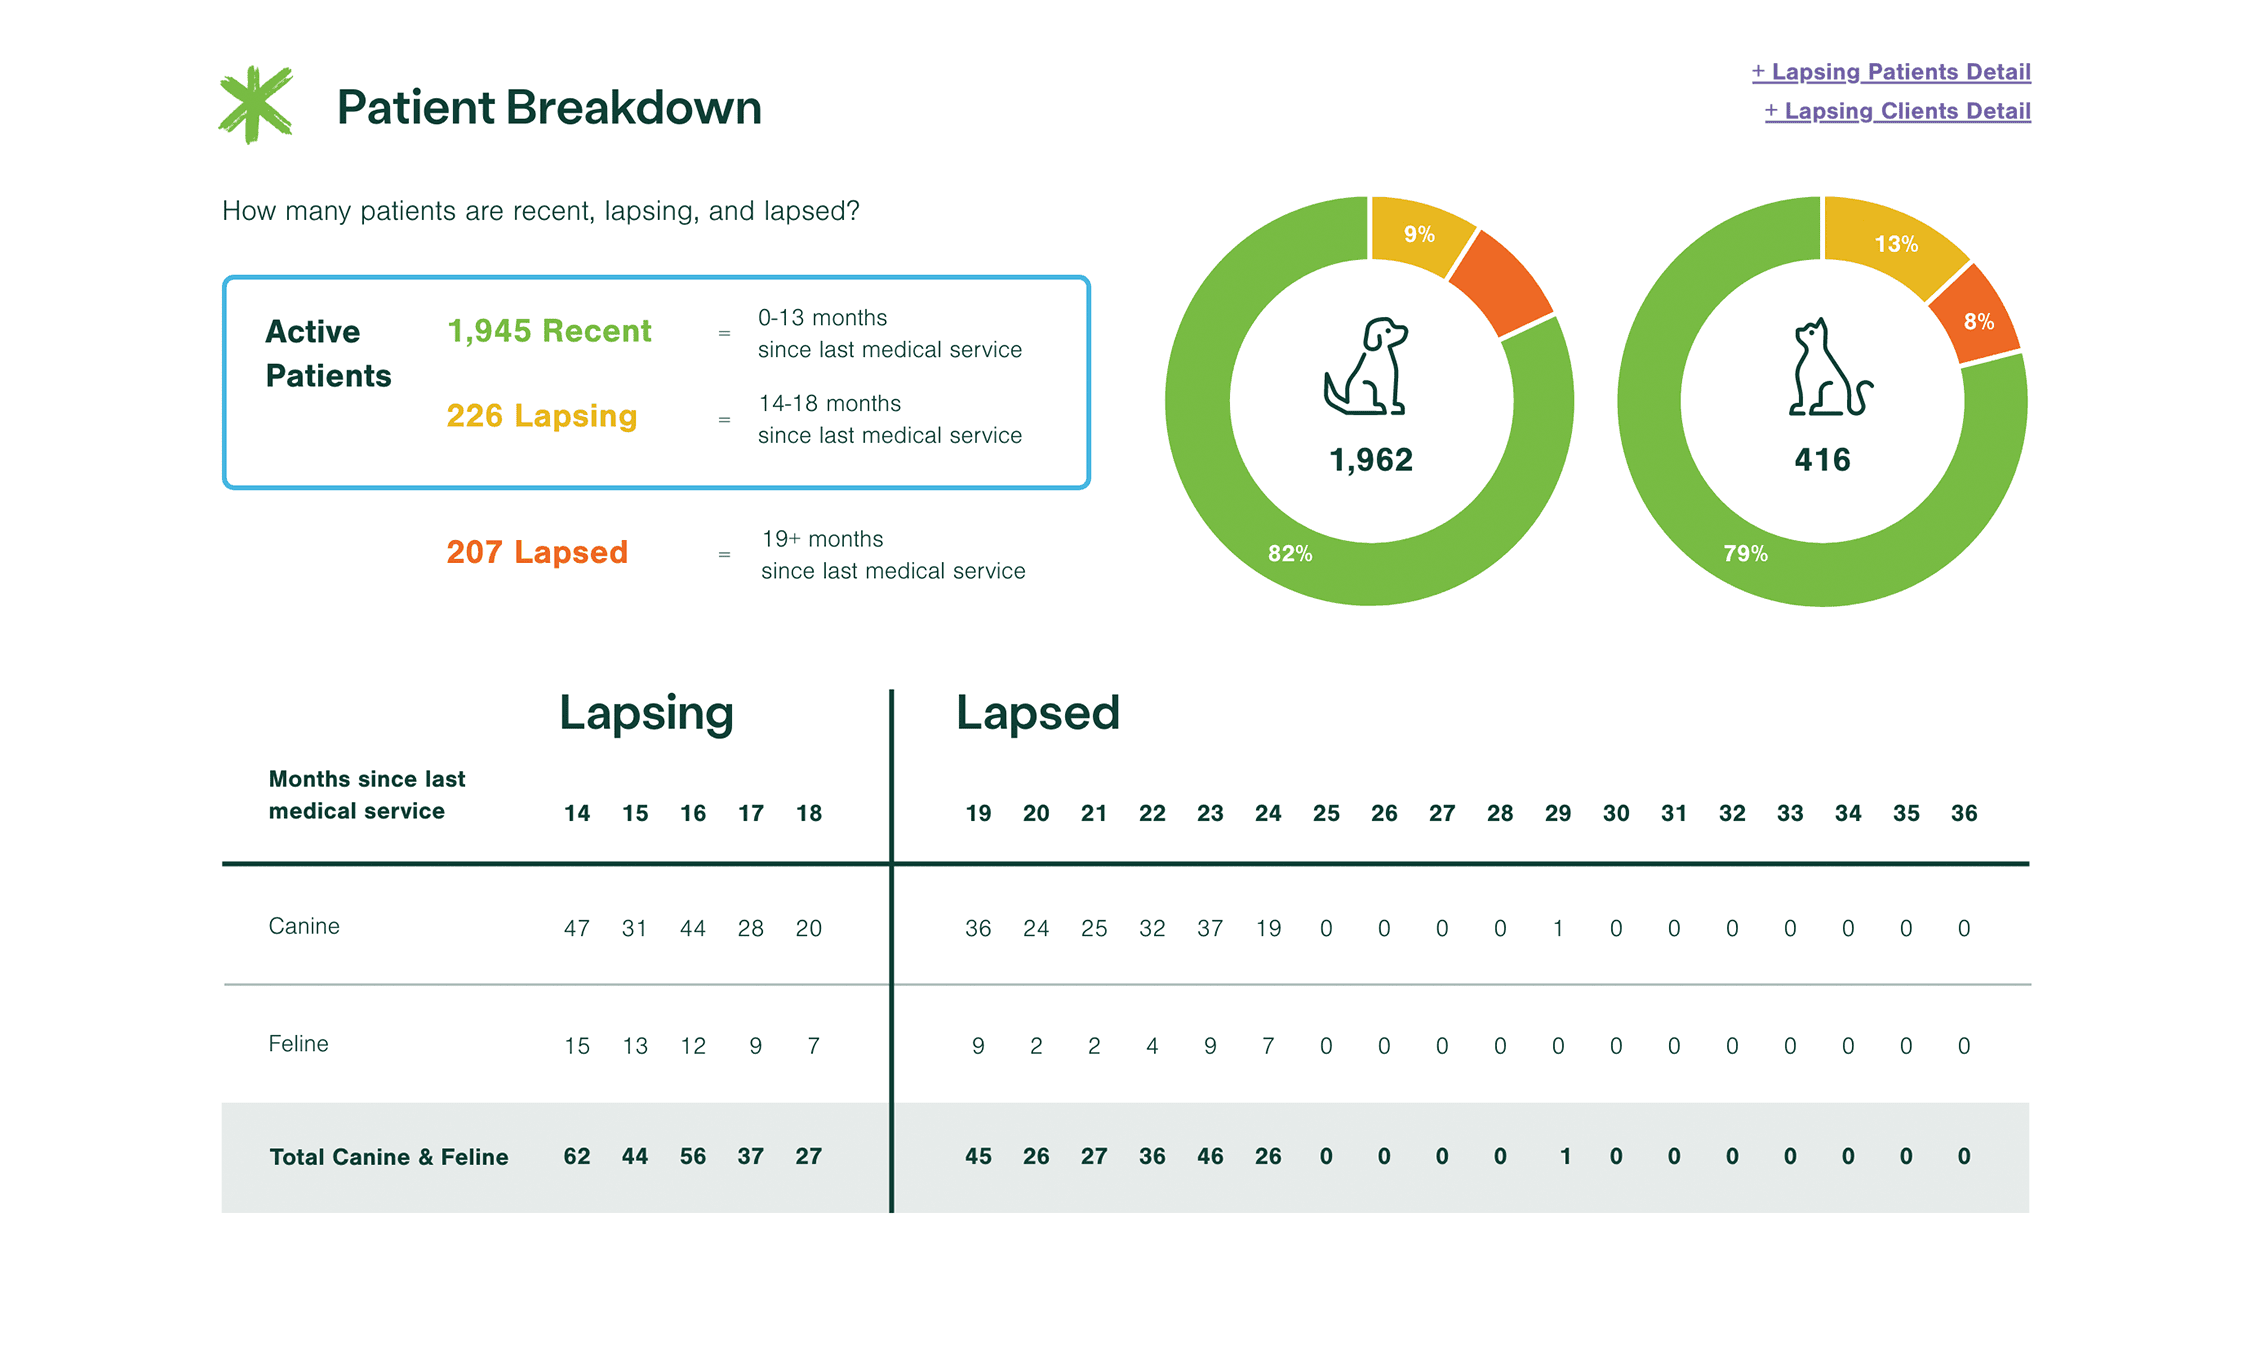
Can you catch patients before they lapse?
Easily track and monitor your patients who are due for care and about to lapse.
A detailed breakdown shows lapsing and lapsed patients. An appendix listing client information for lapsed patients provides a clear path for taking action to get your clients back in your practice.
Revenue metrics
Improve the day-to-day management of your practice by easily monitoring your monthly revenue performance and trends with clear metrics, detailed breakdowns, and benchmarks.
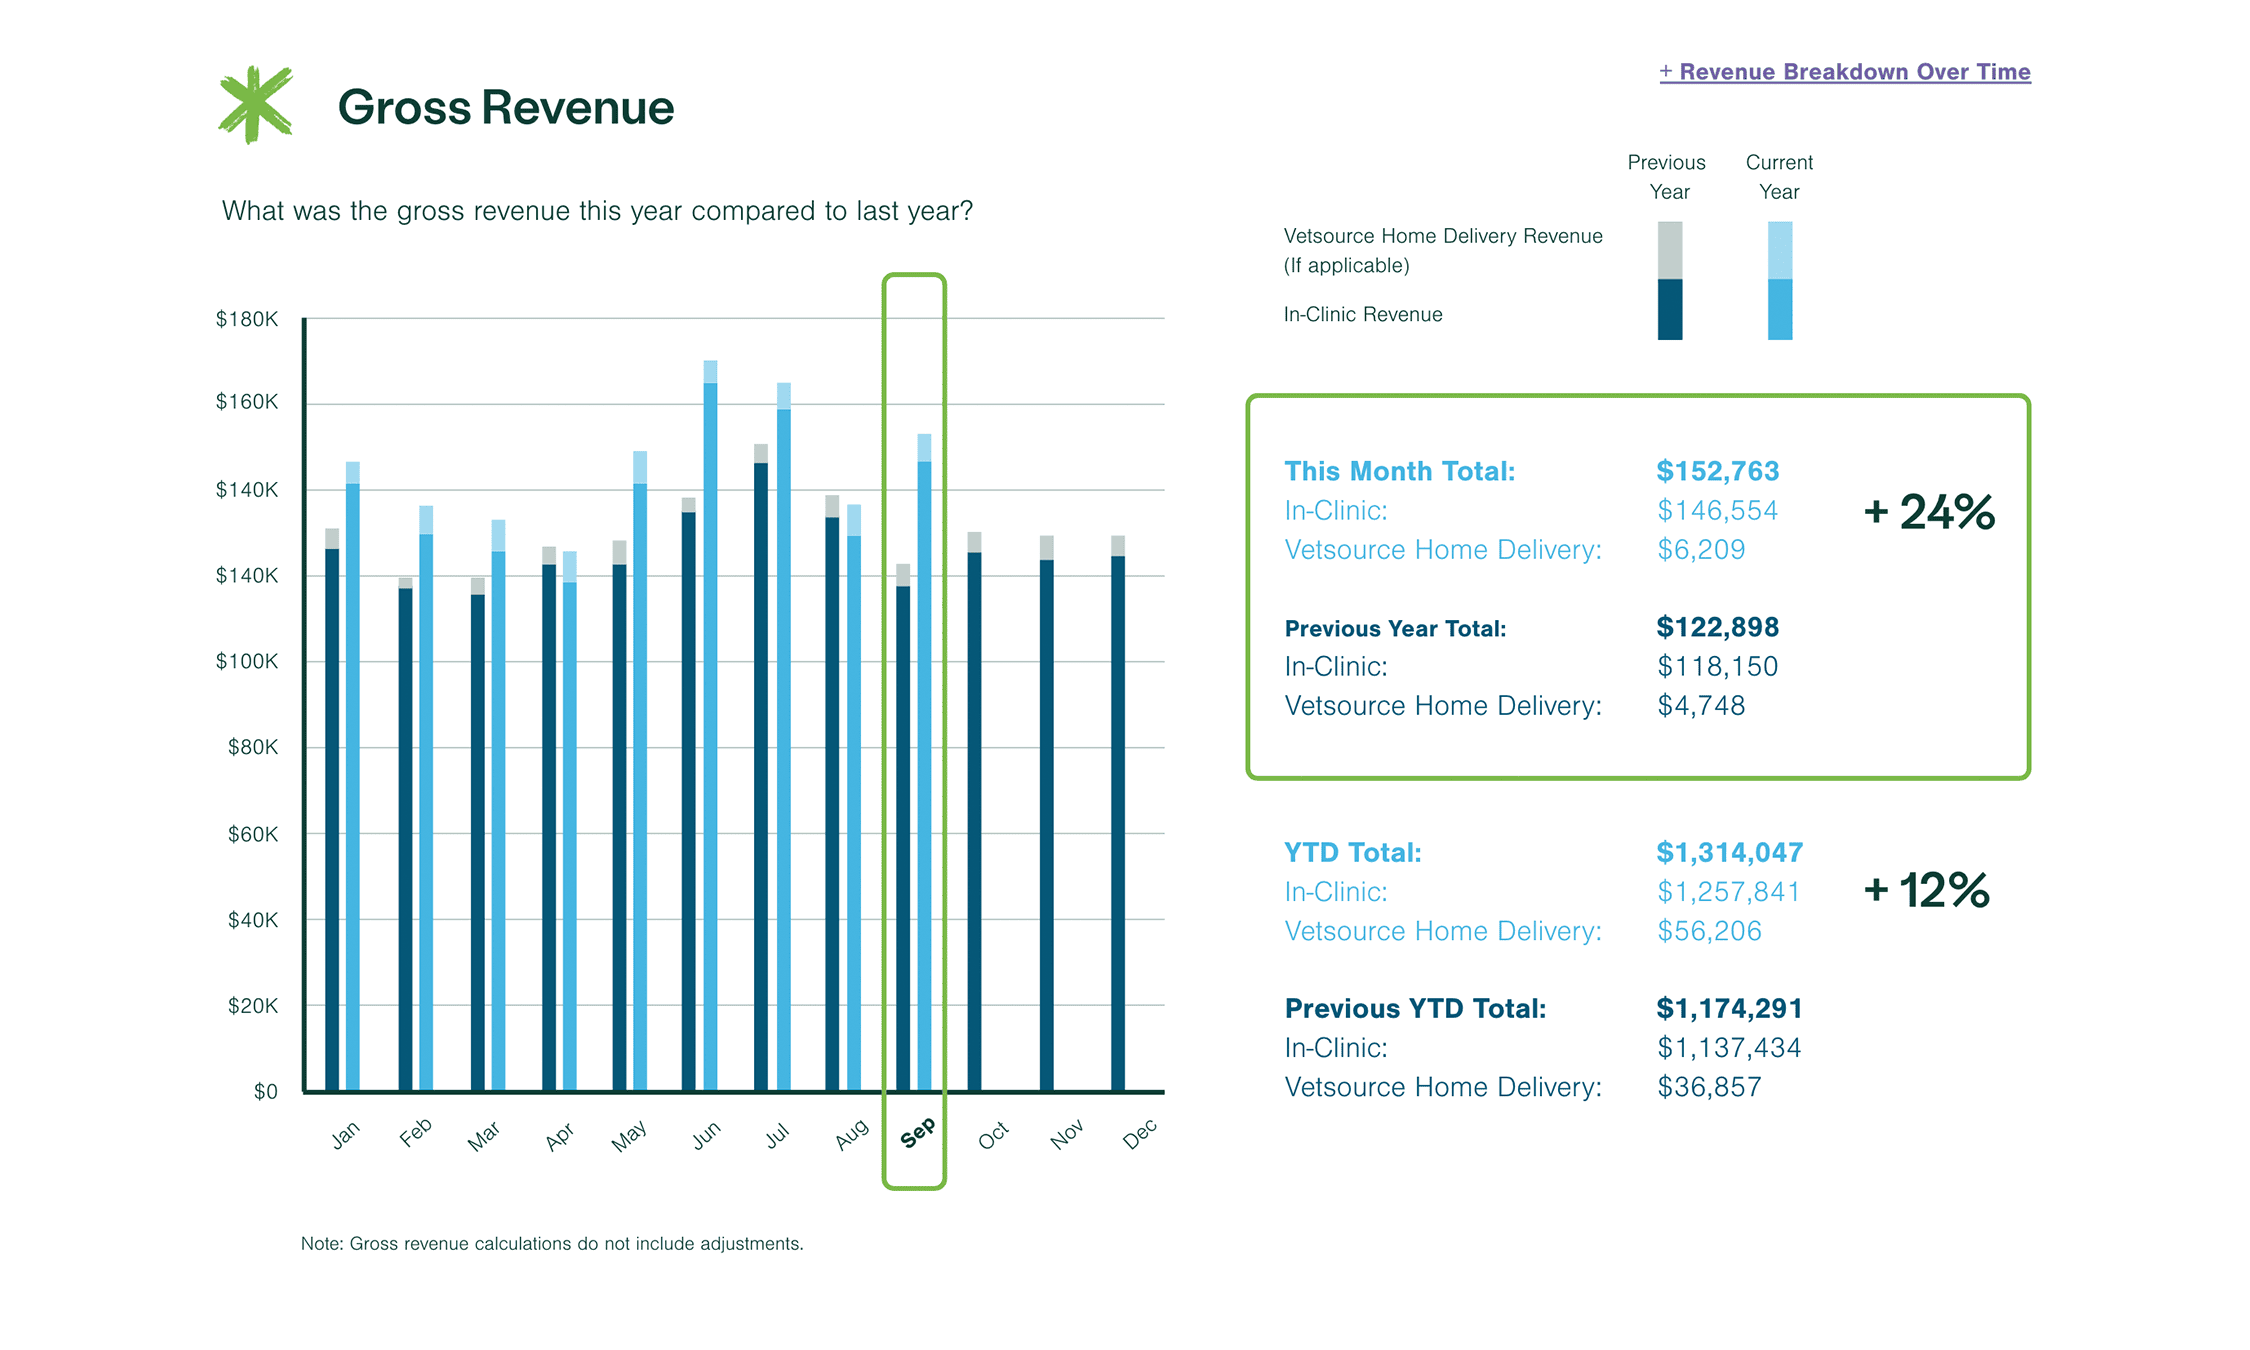
What is your gross revenue this year compared to last year?
Stay on top of your gross revenue trends and goals with clear metrics. Monitor gross revenue throughout the year and easily compare it to last year.
Gain a comprehensive view of Vetsource pharmacy revenue by reviewing in-clinic and Vetsource revenue broken out by month and year to date.
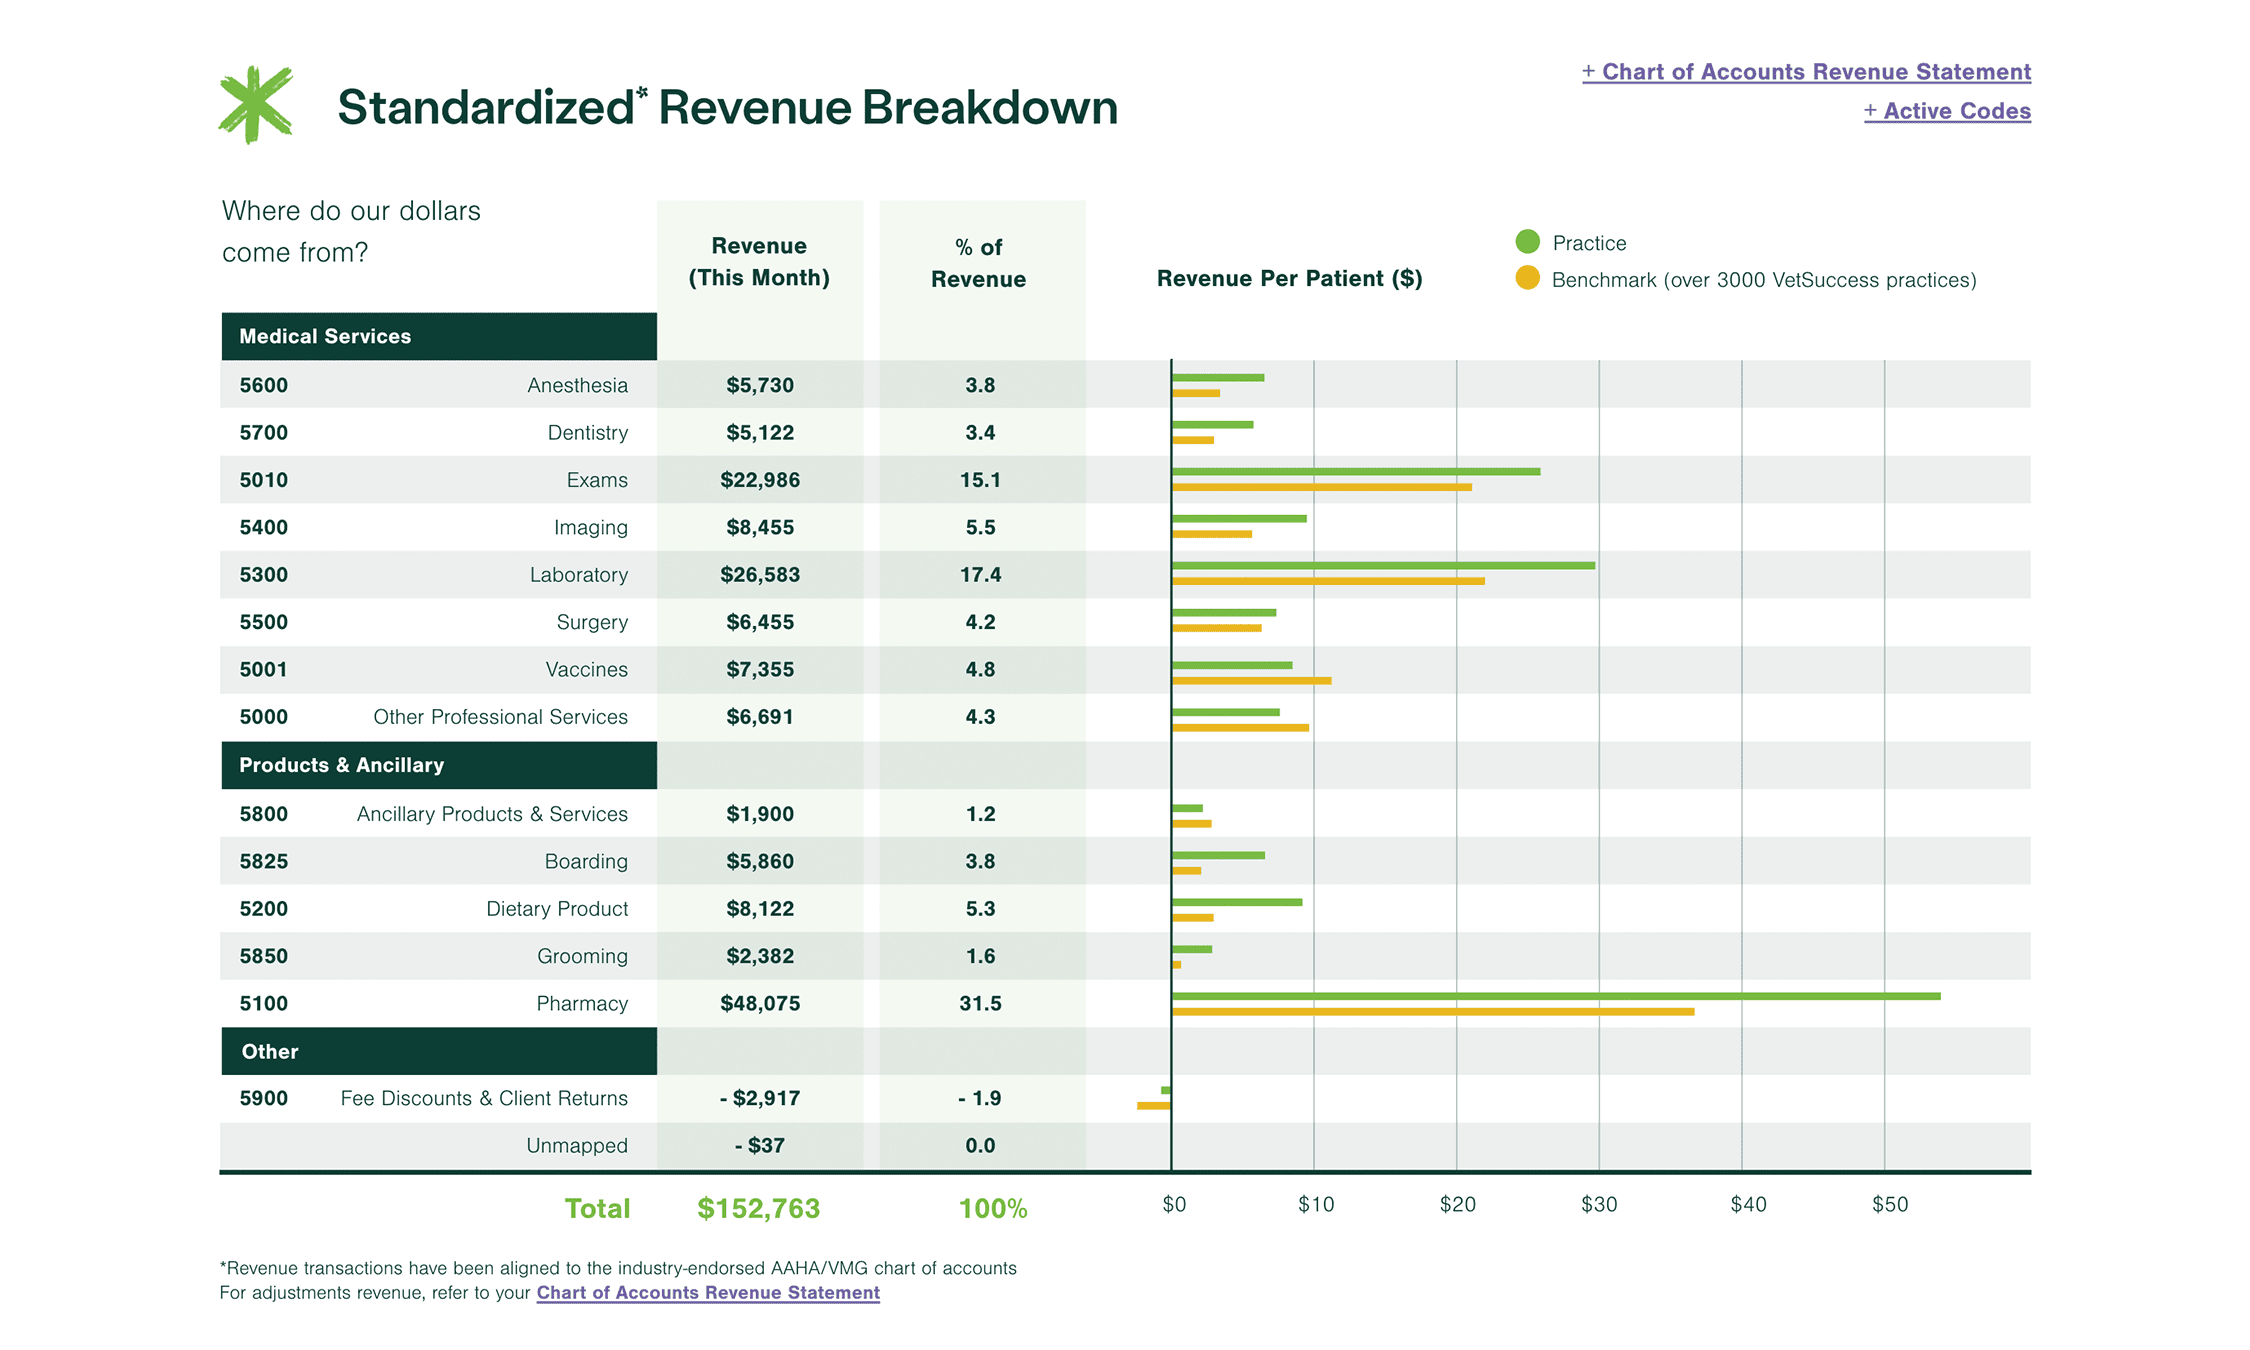
Where are your dollars coming from?
Analyzing revenue earned in each service category gives you a clear understanding of what is actually happening in your practice.
Benchmarks for each category allow you to compare your performance against thousands of other practices nationally.
Can you benchmark your practice against the industry standard?
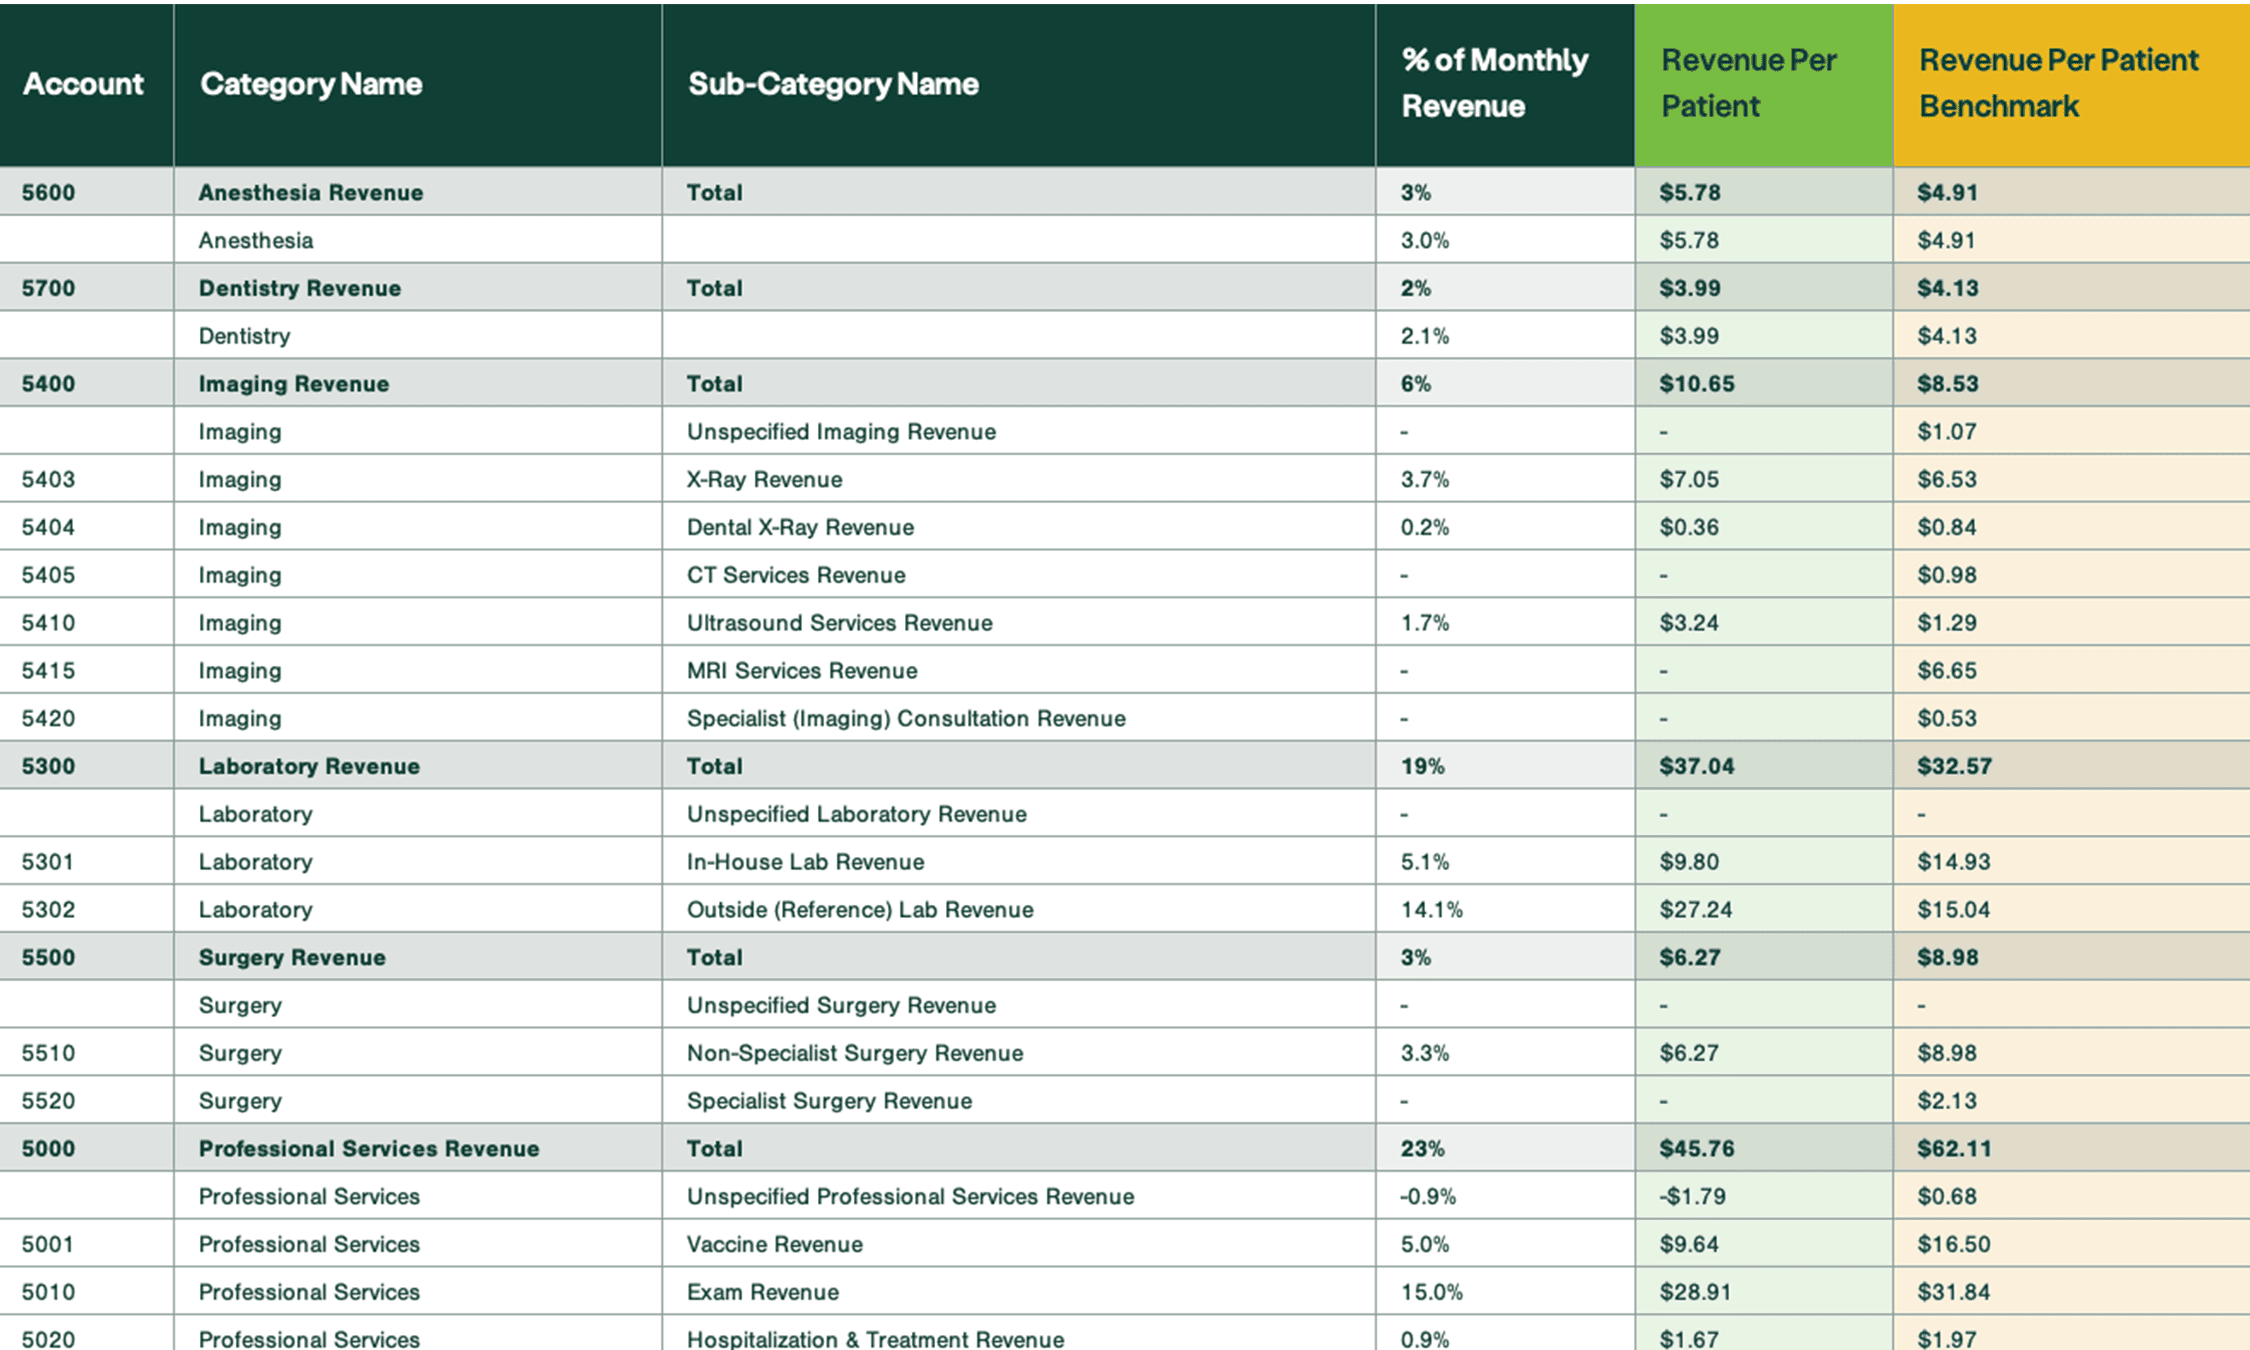
The industry-endorsed AAHA/VMG Chart of Accounts enables better benchmarking by standardizing revenue categories across all practices who adopt the classification system. And now instead of reclassifying every PIMS code, our data experts can do the heavy lifting for you.
Without changing a single code, we will align your revenue codes behind the scenes to the AAHA/VMG Chart of Accounts and then display your revenue metrics and benchmarks accordingly. Use the Chart of Accounts Appendix to review code classification and metrics, plus gauge revenue over time.
Customer experience metrics
Monitor key aspects tied to customer satisfaction, such as forward-booking rate, bonding rate, bonding time, and even email addresses on file.
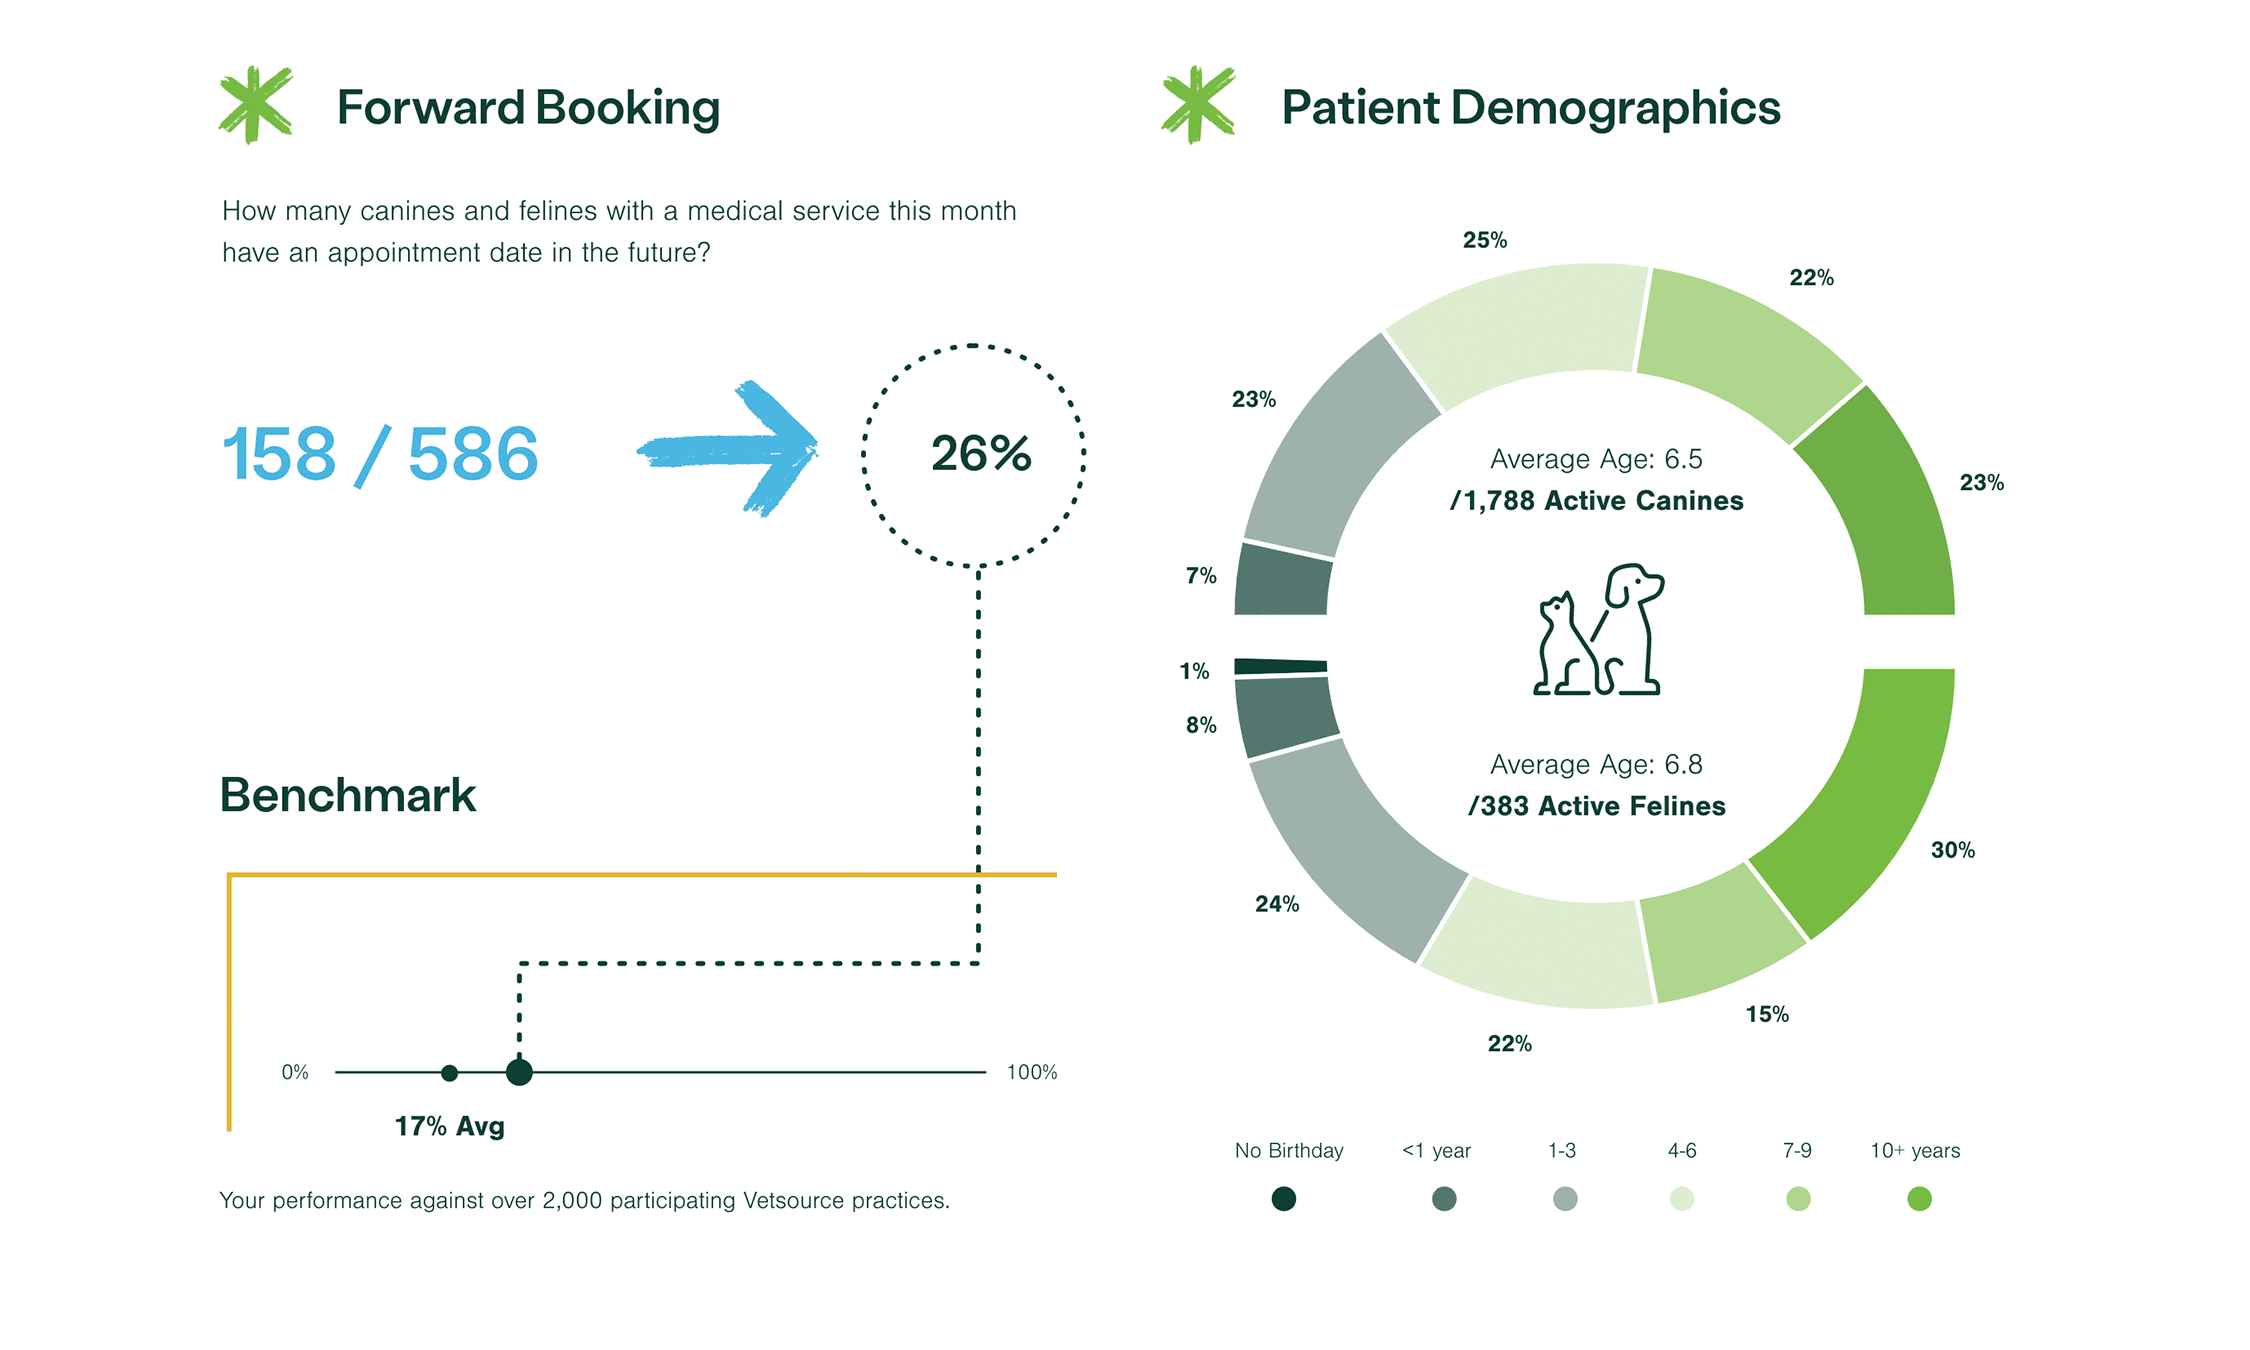
Are you forward booking your appointments?
One of the best ways to ensure that your clients continue to come in regularly is to book their next appointment before they leave.
It’s no secret that what gets measured gets done. Use this metric to set goals with your staff to increase forward booking and report progress on a regular basis.
Are you meeting client expectations and creating loyal fans?
Ensure you’re on the right track by analyzing your bonding rate, the percentage of clients who return to your practice, and bonding time, the number of months it takes clients to return to your practice.
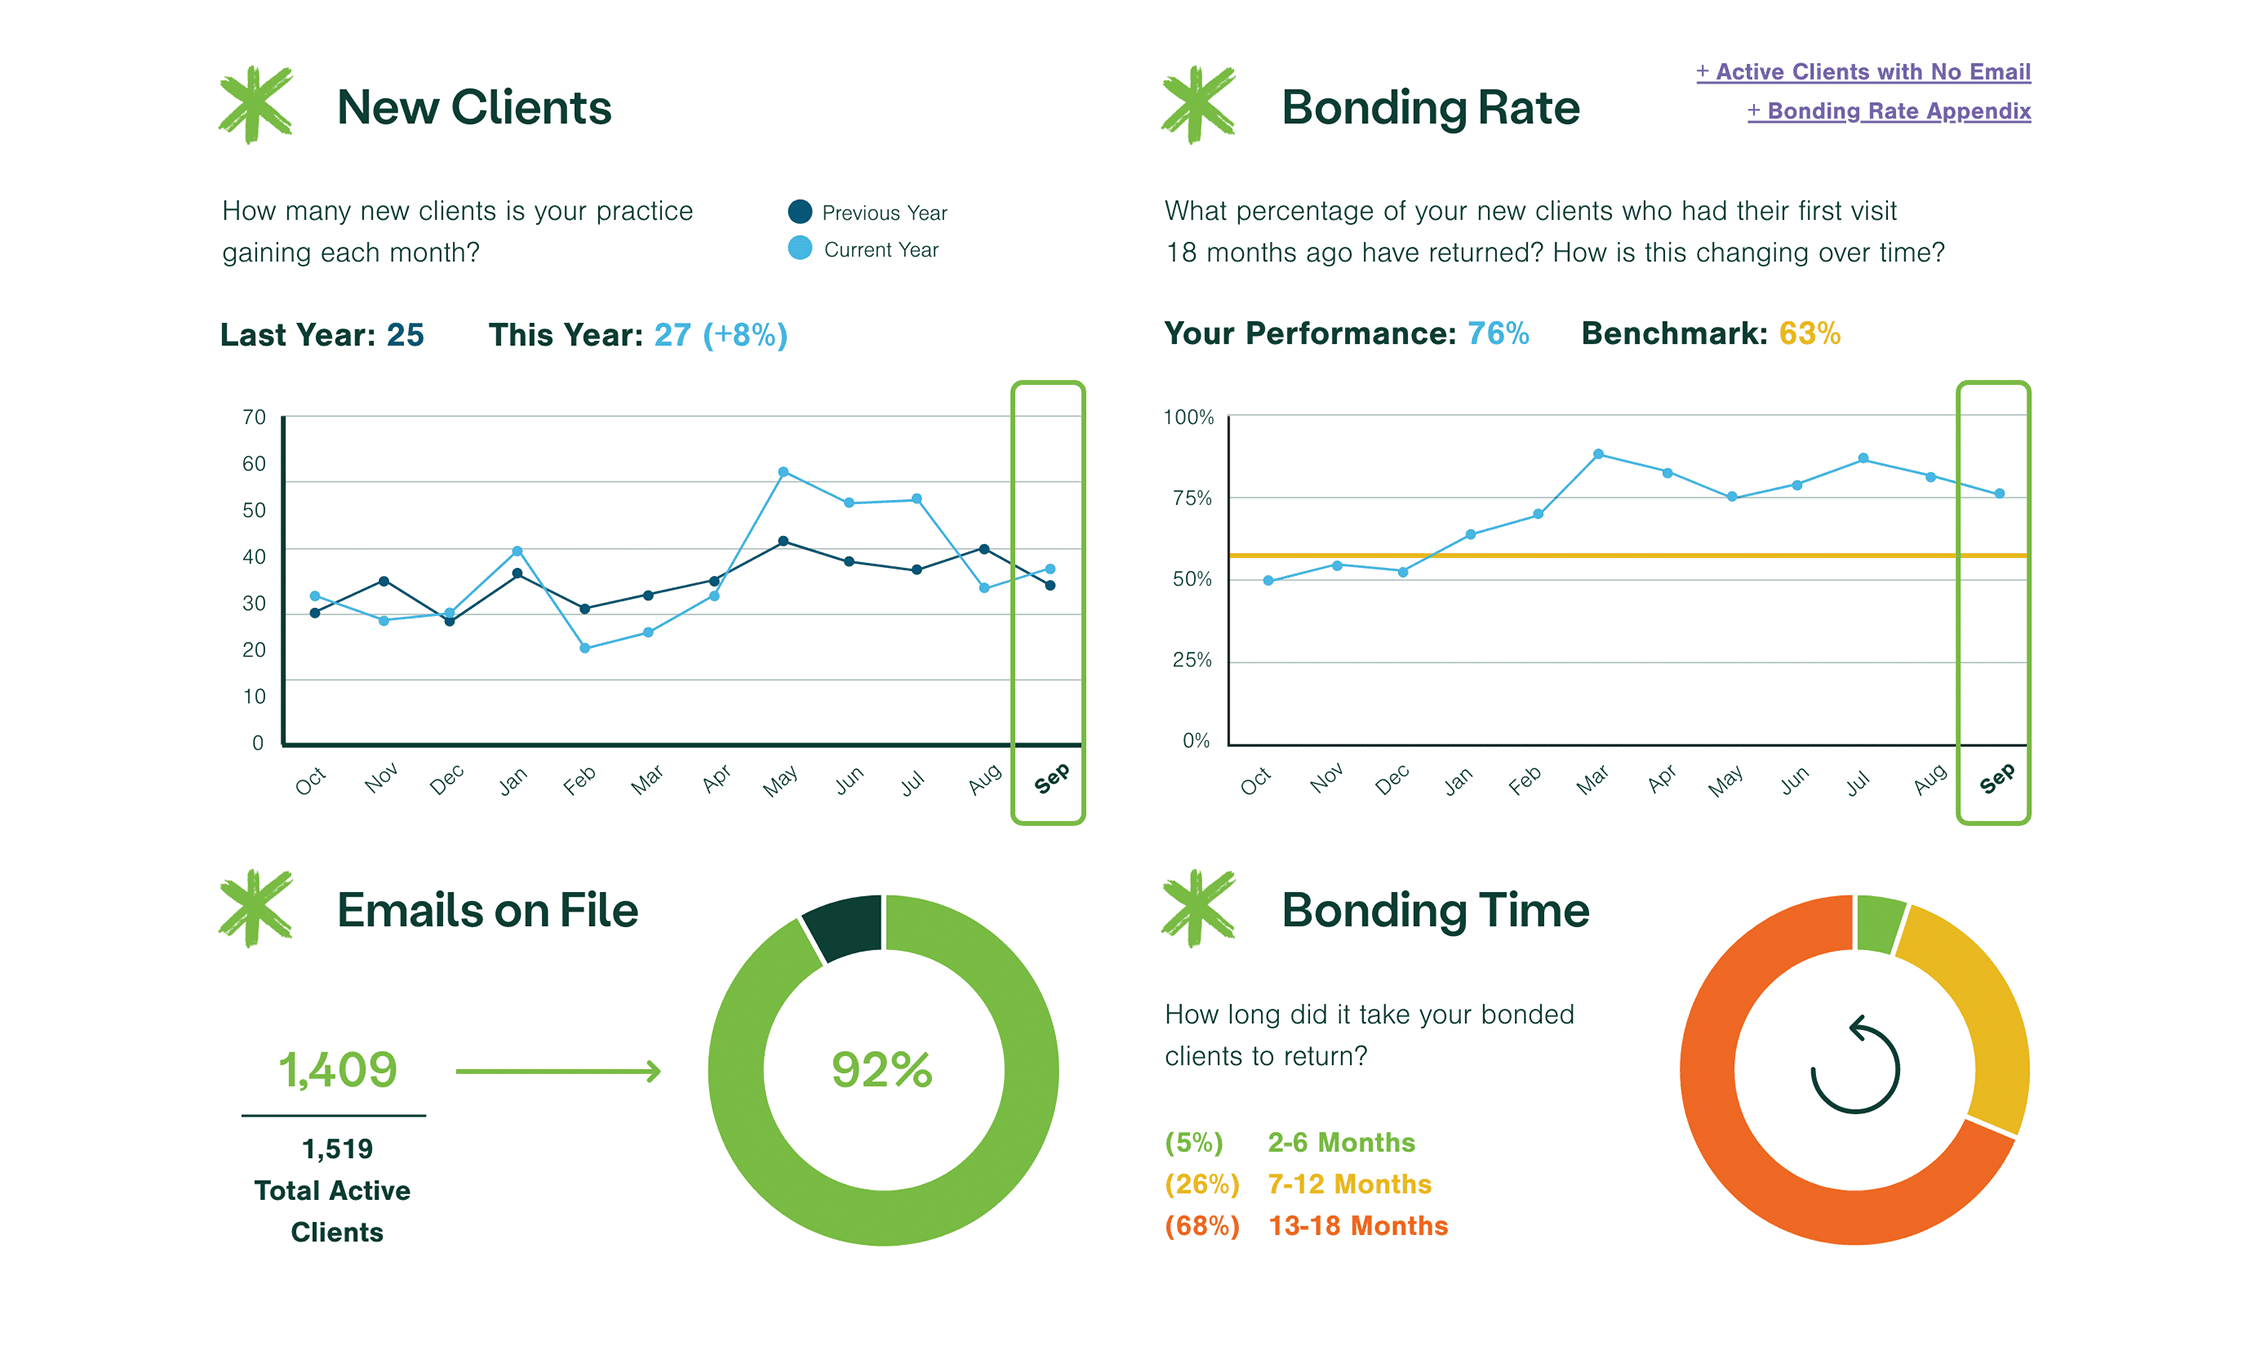
Easy-to-absorb graphs reduce data overload
“Vetsource eliminates the overwhelming feeling of spreadsheets by utilizing visual graphs. This helps me tremendously.”
—Robin Moreau, hospital manager, Greywolf Veterinary Hospital